
Insight into Abas ERP
Discover Abas ERP Costing and Valuation


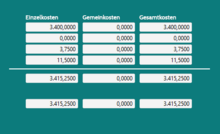
Costing before, during and after production
Before production, preliminary costing helps you determine expected costs and provides a solid basis for preparing a quotation. Different valuations can be used as a basis: purchase price, mixed price, last cost price or planned price. Concurrent costing helps you during production. It shows you to what extent the planning corresponds to reality based on the completion confirmation times and material withdrawals actually posted up to the key date and taking into account the outstanding processes for target costs. This target/actual deviation gives you the opportunity to intervene during the production process if necessary. After completion of the sales order, Final costing summarizes all actual costs (including overhead costs) incurred by a cost object (for example, work order or customer order) and thus provides the basis for a retrograde actual cost overview. In addition, you can identify special situations and cost developments based on the final costing analysis that can be performed over a period of time.
Seamless material and value flows through valuation
Is your production always urgently waiting for material and removes it for a work order immediately after the goods receipt has been posted - even before the vendor invoice is received? At what price should you value this material withdrawal? Abas ERP is able to valuate material receipts at a provisional price. If the vendor invoice is later posted with the actual purchase price, this automatically leads to a revaluation of the receipt. The change in value is passed on to all stages of the subsequent use of the material, including all subsequent costs such as transport costs, cash discounts or credit notes. The valuation in Abas ERP is the basis for this by seamlessly linking the material and value flows. This means you always work with the most up-to-date valuation in all analyses. The valuation also provides the data basis for (concurrent) final costing, mixed price calculation and - when using the material costs posting - for integrated cost accounting.


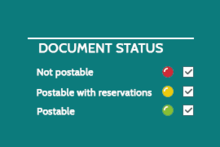
Exact controlling with material costs posting
Material cost posting in Abas ERP determines and posts the costs of the material flows of raw, auxiliary, and operational materials as well as the stock changes of semi-finished (WIP) and finished products. Process gaps are shown using a traffic light function, which enables the user to selectively intervene if necessary. If processing is successful, the values are posted directly to the corresponding balance sheet and P/L accounts in financial accounting. Production costs posting determines the completion confirmation times of personnel and machines and posts them - valuated according to the respective hourly rate for staff and machines. Fixed and variable components as well as special direct costs are also transparently displayed. Statistical entries are used to deliver the values from production costs posting directly to the cost accounting evaluations and are available for detailed analyses.
All function areas at a glance
